Introduction to Load Curve
In power generation and distribution, understanding how electricity demand fluctuates over time is crucial. This is where the load curve comes into play. A load curve provides a graphical representation of electrical power demand over a specific period, allowing utilities and engineers to optimize energy supply, manage resources efficiently, and plan for future needs. In this article, we will explore the key concepts surrounding the load curve, its components, types, and importance in power systems management.
What is a Load Curve?
A load curve is a graph that shows the variation in electrical load over time. The horizontal axis typically represents time (in hours, days, or years), while the vertical axis indicates the power demand (measured in kilowatts, megawatts, etc.).
Load curves are essential tools in power systems for understanding the demand patterns of consumers, allowing utilities to anticipate the amount of electricity that will be needed at various times. By studying load curves, power providers can ensure a balance between electricity generation and consumption, avoid energy waste, and minimize costs.
Components of a Load Curve
Base Load
The base load represents the minimum level of electricity demand over a period. This is the constant power requirement that must be supplied 24/7, such as for critical infrastructure like hospitals and industrial processes. Base load power plants, often fueled by coal, nuclear, or hydropower, are designed to run continuously to meet this demand.
Peak Load
The peak load is the highest level of electricity demand experienced over a specific period, such as during hot summer afternoons when air conditioners are running at full capacity. Managing peak load is critical because power systems must have enough capacity to meet this demand, which can require activating less efficient, more expensive power plants.
Load Factor
The load factor measures the efficiency of energy use by comparing the average load over a period to the peak load. It is expressed as a percentage, where a higher load factor indicates more consistent demand and a more efficient system. A low load factor means large variations in power demand, leading to underutilization of energy resources.
Types of Load Curves
Daily Load Curve
A daily load curve reflects the changes in power demand over a 24-hour period. It typically shows distinct patterns based on human activity, with lower demand during the night and early morning, and higher demand during the day, especially in the late afternoon and evening.
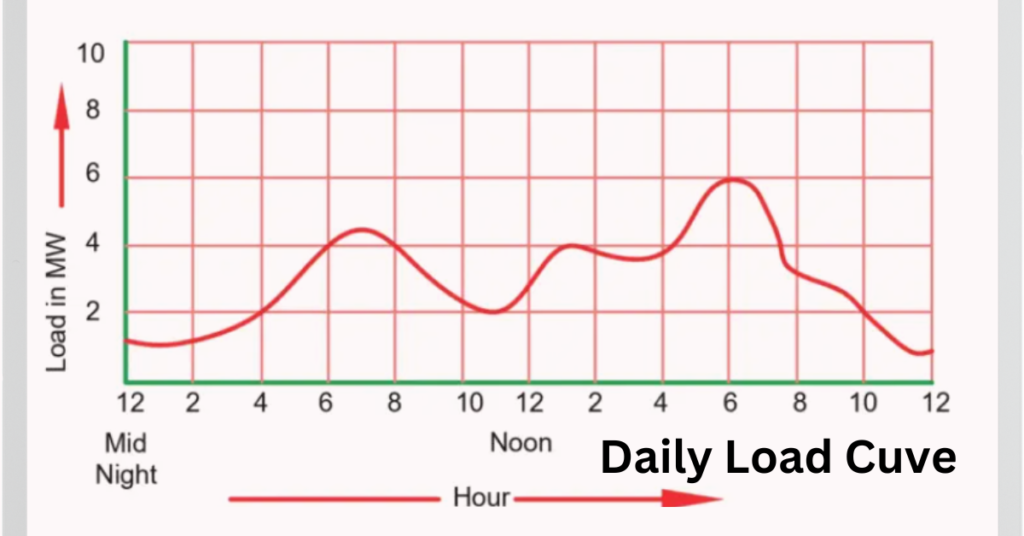
Image Source: www.electricalvolt.com
Weekly Load Curve
The weekly load curve extends the analysis to seven days, providing a broader view of how power consumption varies throughout the week. It highlights different patterns on weekdays and weekends, as industrial and commercial demand typically decreases over weekends while residential use may increase.
Seasonal/Yearly Load Curve
A seasonal or yearly load curve offers insights into long-term trends in power demand. This type of curve is useful for identifying how factors such as weather, holidays, and economic activity affect electricity consumption over months or years. For example, power demand may spike in summer due to air conditioning or in winter due to heating.
Load Curve Variations by Sector
Residential Load Curve
The residential load curve typically shows higher peaks during morning and evening hours when people are at home. This demand pattern is influenced by household activities such as cooking, heating, and entertainment.
Industrial Load Curve
The industrial load curve tends to have more stable and sustained demand during working hours. However, heavy machinery, lighting, and manufacturing processes contribute to higher overall consumption, particularly during peak production times.
Commercial Load Curve
The commercial load curves differ from both residential and industrial sectors. Commercial establishments, such as offices, shopping centers, and schools, usually have a peak demand during business hours and a sharp decline after closing.
Importance of Load Curves in Power Management
load curves plays a pivotal role in power management by providing critical data on electricity consumption patterns.
- Efficient Energy Distribution: Load curves help utilities distribute energy more efficiently by aligning electricity generation with consumption patterns. This minimizes energy wastage and helps in optimizing resources.
- Peak Load Management: Understanding peak load is essential for planning strategies to manage it, such as introducing time-based pricing to shift some demand away from peak hours.
- Future Demand Forecasting: Load curves enable accurate forecasting of future energy demands, which is crucial for infrastructure planning and investment in power generation capacity.
How Load Curves Affect Power Plant Operation
Load curves also influence the operation of power plants. Power plants designed to meet base load demand operate continuously while peaking plants are activated only during high-demand periods. This scheduling ensures an efficient and economical operation of power plants.
- Plant Efficiency: Plants running continuously to meet base load are generally more efficient, while peaking plants may have higher operational costs due to their intermittent usage.
- Maintenance Scheduling: Load curves assist in scheduling plant maintenance during periods of low demand, ensuring minimal disruption to electricity supply.
- Energy Pricing: The cost of generating electricity varies depending on the load. Load curves are critical in determining energy tariffs, with higher prices during peak demand periods.
How to Analyze a Load Curve
Analyzing a load curve involves looking at key parameters such as base load, peak load, and load factor. Engineers use tools and software to process large datasets, identifying patterns, spikes, and trends over time.
- Steps for Interpretation: Identify the base load, locate the peak demand times, and calculate the load factor to assess system efficiency.
- Tools and Software: Specialized software like MATLAB, Python libraries, and SCADA systems can be used to analyze load curves for optimization purposes.
Challenges and Solutions in Managing Load Curves
One of the major challenges in managing load curves is the fluctuations in power demand, which can strain the electrical grid. Addressing these fluctuations involves:
- Demand Response Programs: Encouraging consumers to reduce consumption during peak times.
- Energy Storage Solutions: Using batteries and other storage technologies to balance supply and demand.
- Load Shifting: Incentivizing consumers to use electricity during off-peak hours through time-of-use pricing.
Conclusion
In conclusion, the load curve is a crucial tool for power generation and distribution. It offers important insights into electricity usage patterns. By analyzing the load curves, utilities can better manage resources, enhance system reliability, and plan for future energy demands. As renewable energy and new technologies become more integrated into power systems, load curve analysis will continue to be key for effective energy management.
Read Next: